

Files
Download Full Text (1.6 MB)
Date of Presentation
5-7-2026
Document Type
Poster
Department
Medicine
Faculty Mentor
DenYelle Kenyon, PhD, University of South Dakota Sanford School of Medicine
Second Advisor
Zachary Schild, BS, University of South Dakota Department of Biology
Keywords
overweight children, body mass, green space, land cover, grass, trees, shade
Subject Categories
Demography, Population, and Ecology | Environmental Public Health | Medicine and Health Sciences | Nutritional and Metabolic Diseases
Abstract
Using Geospatial Analysis and Machine Learning to Compare Metropolitan Greenspace and Rates of Adolescents with Obesity
Rachel Schild MD | DenYelle Kenyon PhD
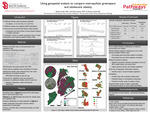
Introduction: Insufficient outdoor activity, influenced by limited access to exercise-friendly greenspaces, may contribute to increasing childhood obesity rates. However, rigorous evaluation of greenspace quality on a citywide scale is lacking. This study aims to characterize greenspace vegetation types and correlate them with adolescent obesity outcomes, identifying optimal characteristics for promoting health. This data could aid city planners in optimizing greenspace allocation and improving vegetation choices.
Methods: Satellite imagery and municipal data were used to map ten cities, classifying urban, water, grass, and tree areas while excluding areas unlikely to be used by children. A Random Forest model was trained for each city and assessed using validation data. Adolescent obesity rates were analyzed in relation to grass, tree, and greenspace percent cover using a Bayesian regression model. Slope and 95% Credible Interval (CI) were calculated. Percent confidence in slope direction was obtained by sampling from the posterior distribution.
Results: Classified maps were created for ten major US cities. For grass, a likely positive correlation is suggested (slope 0.21, CI ‑0.2 to 0.63, 85% confidence slope>0), while greenspace indicates a likely negative correlation (slope -0.13, CI ‑0.4 to 0.13, 85.5% confidence slope< 0) with adolescent obesity rates. Similarly, tree area exhibits a likely negative correlation (slope -0.16, CI ‑0.37 to 0.06, 93.5% confidence slope< 0). Income, safety, and physical activity were assessed as confounding variables; findings do not provide significant explanatory power or improve the model fit, indicating that these are weak confounding variables
Conclusions: Given the rising trend in childhood obesity, alterations to children’s environments are essential for promoting health. The study suggests increasing tree cover may reduce pediatric obesity rates, with negative associations found between percent greenspace and tree area and adolescent obesity rates (85.5 and 93.5% confidence, respectively). Furthermore, a likely positive correlation was found between grass and adolescent obesity (85% confidence). As a result, cities should prioritize using Geographic Information Systems to identify areas needing access to safe green spaces with shade-providing vegetation like trees, potentially lowering adolescent obesity rates and improving citywide health outcomes.
Recommended Citation
Schild, Rachel; Kenyon, DenYelle; and Schild, Zachary, "Using Geospatial Analysis to Compare Metropolitan Greenspace and Adolescent Obesity" (2026). Scholarship Pathways Program. 31.
https://red.library.usd.edu/spp/31
Included in
Demography, Population, and Ecology Commons, Environmental Public Health Commons, Nutritional and Metabolic Diseases Commons